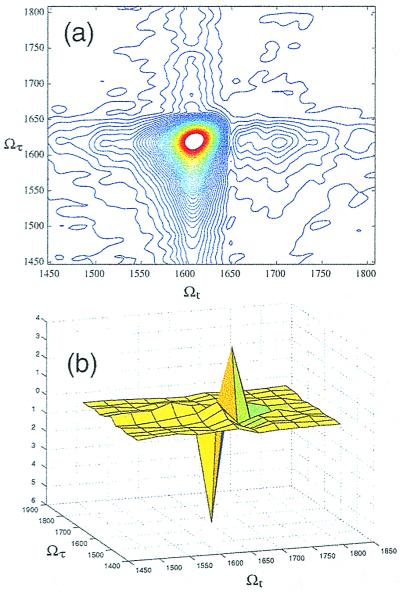
Figure 4.
2D-IR spectra for NMA-d in D2O. (a) The absolute value of the 2D-IR spectrum, showing a single peak in both frequency dimensions. The asymmetry in the signal (compare simulation of Fig. 2) is sensitive to the choice of the center frequency of the laser pulses in relation to the resonances. (b) The real part of the 2D-IR spectrum, showing the fundamental and anharmonically shifted peaks, which have opposite signs.

