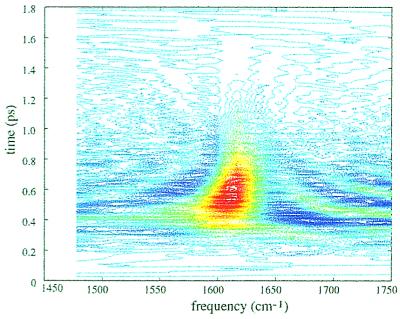
Figure 5.
A plot of the Wigner distribution for the NMA-d heterodyne echo signal, showing a time-dependent frequency shift in the echo field. For a real signal S(t), the Wigner distribution is defined as w(ν̄, t) = ∫−∞∞ dt′S(t − t′/2)S(t + t′/2)ei2πcν̄t′. The laser pulse shows a chirp-free, symmetric Wigner distribution.

