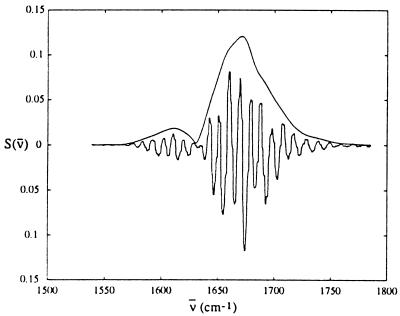
Figure 8.
Spectral interferometry of the echo signal for acyl-proline in D2O, with the local oscillator delayed 1.5 ps from the echo signal. Shown are both the measured interferometric signal and the processed signal, which represents the emitted electric field of the echo. This signal shows peaks at 1,610 and 1,670 cm−1 corresponding to the frequencies of the two amide units.

