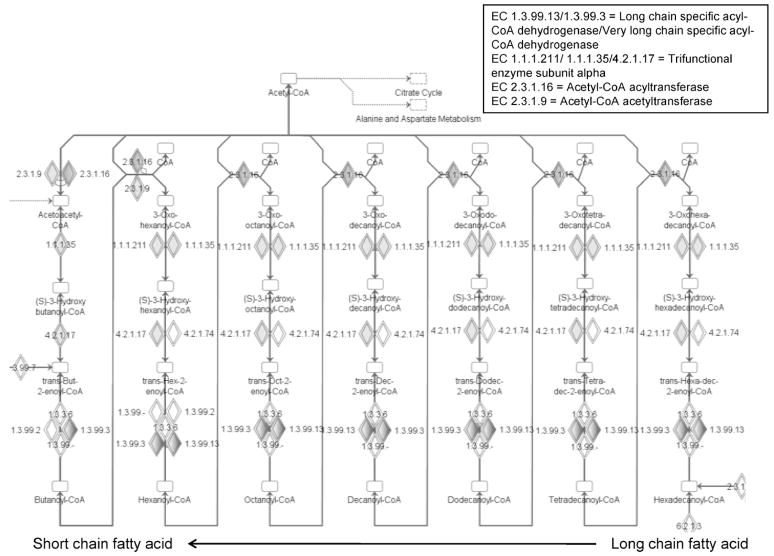
Figure 5.
Fatty acid metabolism pathways represented by carbonylated proteins. Proteins with enzymatic activities within this pathway and identified in our studies as having significant age-related changes in carbonylation are highlighted by the grey-shaded diamonds. Figure depicts successive steps of oxidation of long-chain fatty acids (starting at the bottom right and moving right to left), with each step reducing the fatty acid chain by two carbons, and producing acetyl-coenzyme A (acetyl-CoA). Enzyme commission (EC) numbers and the proteins identified with corresponding activities are shown.

