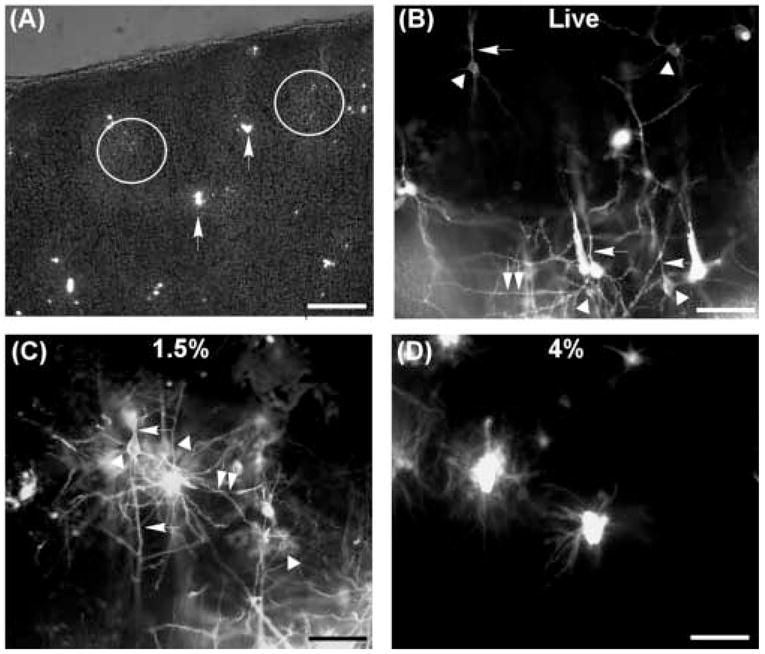
Figure 1.

DiI labeling in cortical slices. A, DiI crystals delivered on the surface of slices using a glass micropipette. The image was taken immediately after dye loading. Usually, very fine crystals were delivered onto the surface (fine speckles inside the white circles). DiI crystals sometime clumped together emitting very bright epifluorescence (arrows). The fluorescent image was taken under light illumination to show the edge of the slice. B,C, Labeled neuronal processes in live slices (B) and lightly fixed slices (C). Labeling quality was comparable to each other. Arrow heads indicate neuronal somas, arrows apical dendrites, and double arrows basal dendrites. (D) DiI labeling in slices fixed with 4% paraformaldehyde. Dye diffusion was very limited compared to (B) and (C). Scale bar in (A) = 500 μm, in (B,C,D) = 100 μm.
