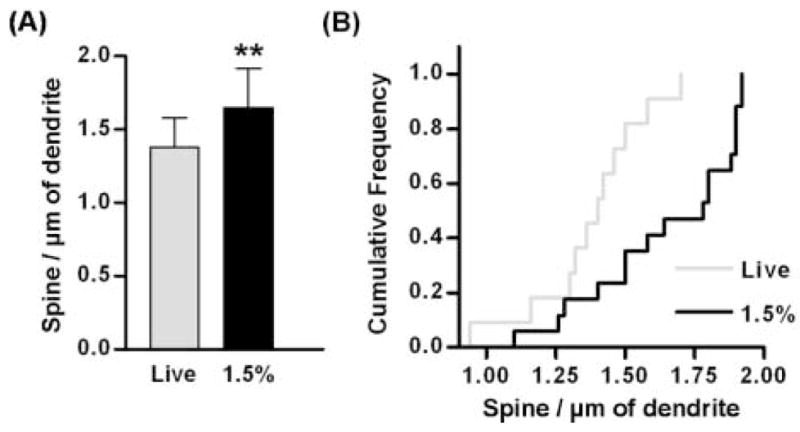
Figure 3.

Comparison of spine density measured in live and lightly fixed slices. Spine density measured in lightly fixed slices (black) was higher than that in live slices (gray). Asterisks indicate a statistically significant difference by unpaired T test (p < 0.01). Error bars indicate standard deviation. (B) Cumulative frequency histogram of spine density.
