Figure 1.
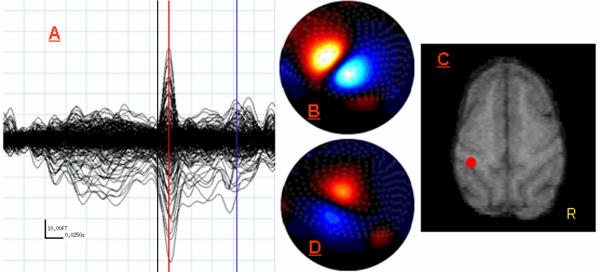
MEG Data from Study 1: Right Second Digit Tactile Stimulation. (A) Butterfly plot showing all 275 MEG sensors from -180 ms to 145 ms post-stimulus onset. Aqua lines indicate 25 ms (x-axis) by 10 fT (y-axis) increments (see scale in bottom left). The black line indicates stimulus onset (0 ms) and the red line marks the peak latency of the earliest and largest response, which was reached 16 ms after the stimulus onset. The blue vertical line marks the peak latency of the later response at 96 ms. (B) Flux map reflecting field strength gradients across the sensor array at 16 ms. Red represents negative flux and blue represents positive flux. These 2D maps are shown in neurological convention with the front of the MEG helmet oriented toward the top of the figure and the left side of the head on the left. (C) Axial MRI slice on the monkey displayed in neurological convention. The red dot (posterior to the left central sulcus) indicates the spatial location of the ECD computed for the response peaking at 16 ms. (D) Same as (B) except map displays field strength across the array at 96ms (peak latency for later response). Notice the orientation of the current source has rotated almost 90 degrees, but that the center of the zero crossing remains largely the same.

