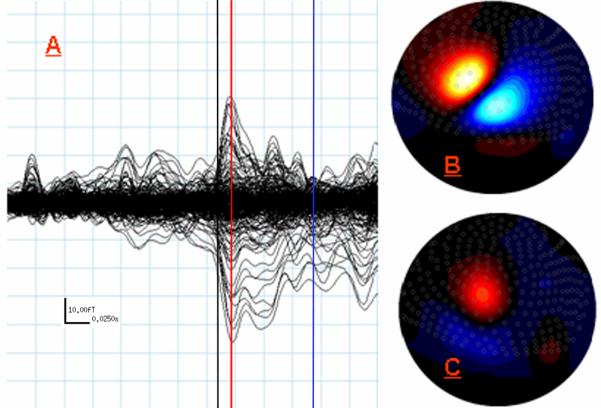
Figure 3.
MEG Data from Study 3: Right Fifth Digit Tactile Stimulation. (A) Same as (A) in Figures 1-2, except the red line indicates 15 ms which was the peak of the earliest and strongest response for fifth digit stimulation, and the blue line indicates the peak of the later response at 86 ms (note scale in bottom left). (B) Flux map reflecting field gradients across the sensor array at 15 ms. Orientation and color mapping are consistent with Figures 1-2. (C) Same as (B) except map displays field strength across the array at 86ms (peak latency for later response). Notice overall field strength is considerably weaker than that observed for the later response in Studies 1-2. Although, with respect to the earlier fifth digit response, the center of the zero crossing has rotated roughly orthogonally and the location has remained largely unchanged.

