Fig. 2.

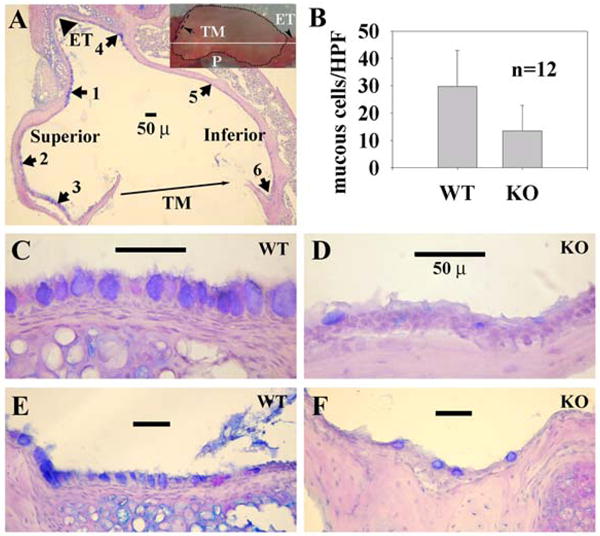
Reduction of goblet cell numbers in the middle ear mucosa of mutant mice by Pn6A. Panel A represents an overview of bullar section with triangle pointing to the Eustachian tube (ET), solid line indicating the tympanic membrane (TM), numbers 1–3 standing for the superior of the middle ear cavity and numbers 4–6 for the inferior of the middle ear cavity. Insert indicates the inferior view of the bulla (dotted line) with arrow to TM and arrowhead to ET (P, promontory; white solid line, cross section orientation). Panel B represents for averaged goblet cell numbers ± standard deviation per high power field (HPF) from the 6 locations indicated in A. Pn6A induced MCM in the middle ear mucosa of wildtype (WT, panels C and E at locations 1 and 4, respectively) mice but less so in the middle ear mucosa of IL-10 knockout (KO, panels D and F at locations 1 and 4, respectively) mice. Bar=50 μ in panels A and C–F.
