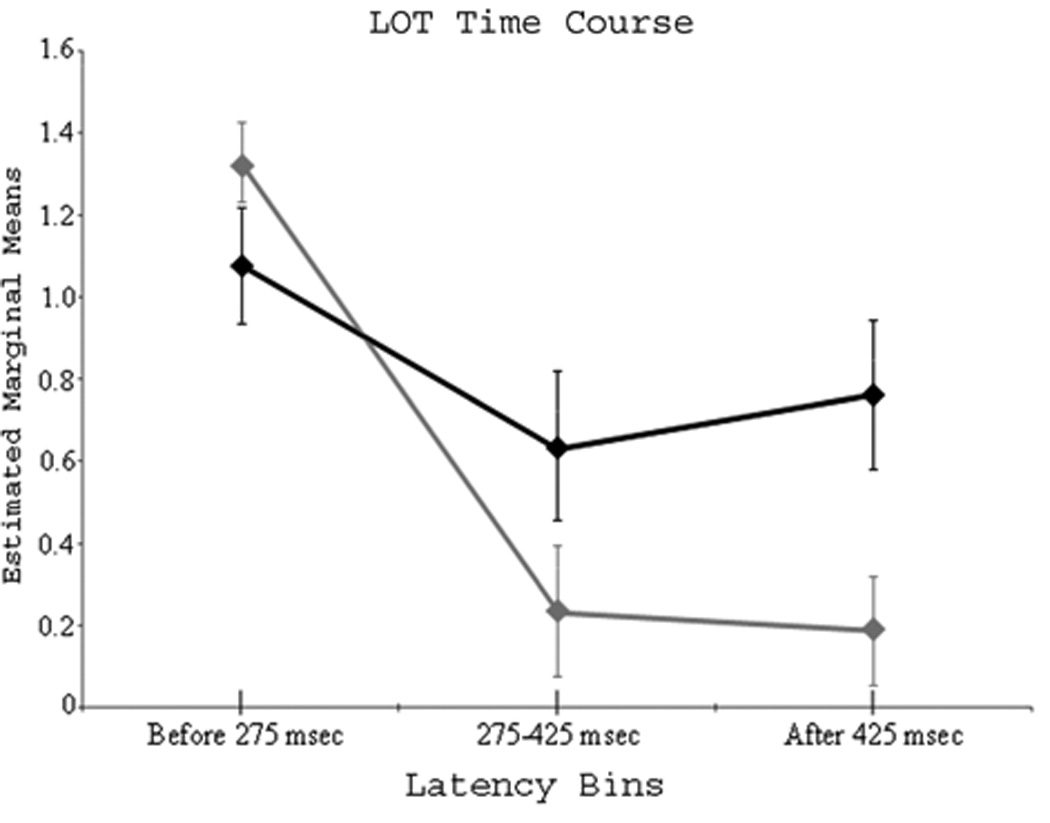
Figure 3.

Time course of LOT cortices. Sources localizing to LOT/anterior fusiform cortex during each of the three latency bins for both conditions. The black line represents the word condition and the gray line refers to the pseudoword condition. The ordinate displays estimated marginal means of the dependent measure (i.e., number of sources per latency bin, after data transformation). LOT activation was significantly greater for words after 425 ms (p < 0.05), but this trend is clearly visible in the middle latency bin (275–425 ms) indicating LOT cortices distinguish cognitive dimensions of orthographic stimuli shortly after ~275 ms. Error bars represent one standard error of the mean.
