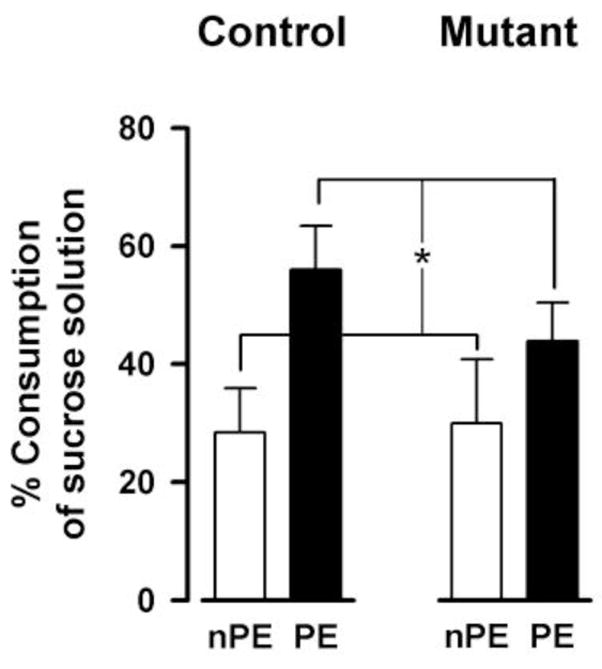
Figure 9.

LI in conditioned taste aversion. The expression of conditioned taste aversion on the test day (24h after sucrose-LiCl pairing) was indexed by the percentage of sucrose solution consumption in the 30 min test session. The lower the value the greater is the taste aversion. Weaker conditioned aversion in the pre-exposed (PE) relative to the non-pre-exposed (nPE) condition constitutes the LI effect (*p < 0.05). All values refer to mean ± standard error of the mean (SEM)..
