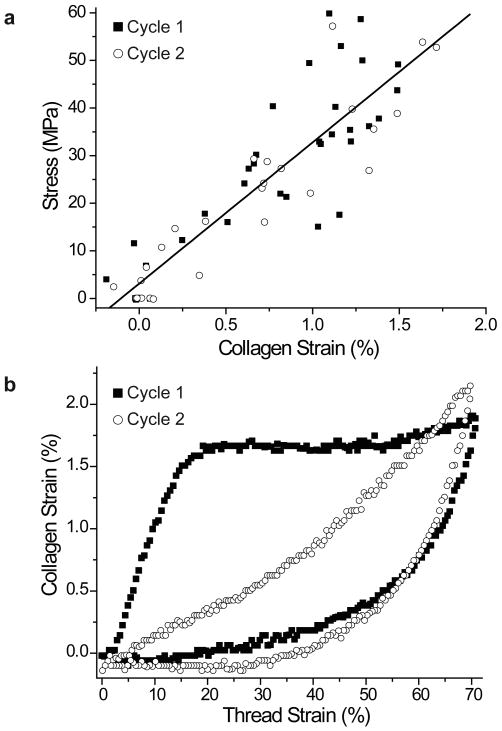
Figure 5. Collagen molecular strain during cyclic loading of byssal threads.
a) Collagen strain values from both cycles of five thread specimens are plotted against thread stress. The black line indicates a linear regression curve of the data points (N=65, R2=0.80) and reveals that the collagen behaves elastically at thread strain values up to 70%. The Young's modulus of the collagen domain was determined from this plot to be 2.97±0.19 GPa (mean±s.e.m), and this value was used to convert thread stress values to derived instantaneous collagen strain values as seen in the representative sample in (b). Cycle 2 follows cycle 1 with little rest between.

