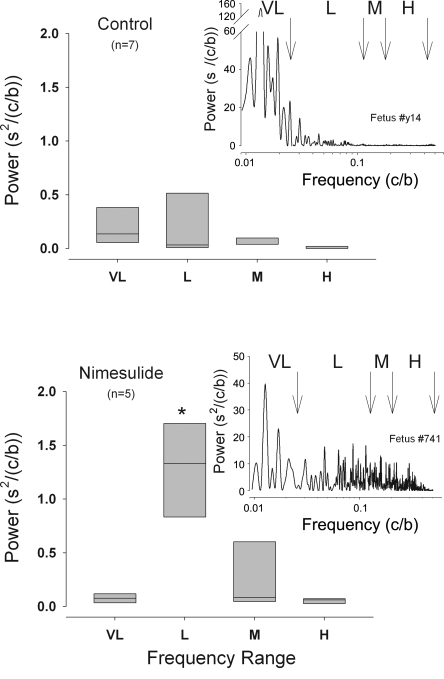
Fig. 4.
Spectral power of fetal heart rate variability in four ranges of frequency (VL, 0.001–0.025 cycles/beat; L, 0.025–0.125 cycles/beat; M, 0.125–0.2 cycles/beat; H, 0.2–0.5 cycles/beat) in control (top) and nimesulide-treated (bottom) fetuses prior to BCO. Power spectra for representative individual fetuses in each group are shown as insets (nimesulide fetus #741, top; control fetus #y14 bottom). Summary data are represented as box plots with outer edges representing 95th and 5th percentile and horizontal lines representing median.

