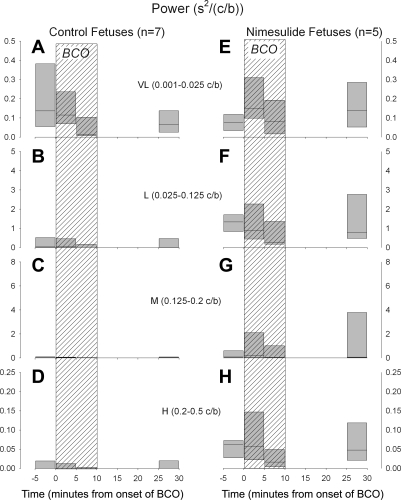
Fig. 5.
Spectral power of fetal heart rate variability before, during, and after brachiocephalic occlusion (BCO, hatched areas) in control (left) and nimesulide-treated (right) fetuses. Summary results are shown for very low (VL, A and E), low (L, B and F), middle (M, C and G), and high (H, D and H) frequency ranges. Summary data are represented as box plots with outer edges representing 95th and 5th percentile and horizontal lines representing median.

