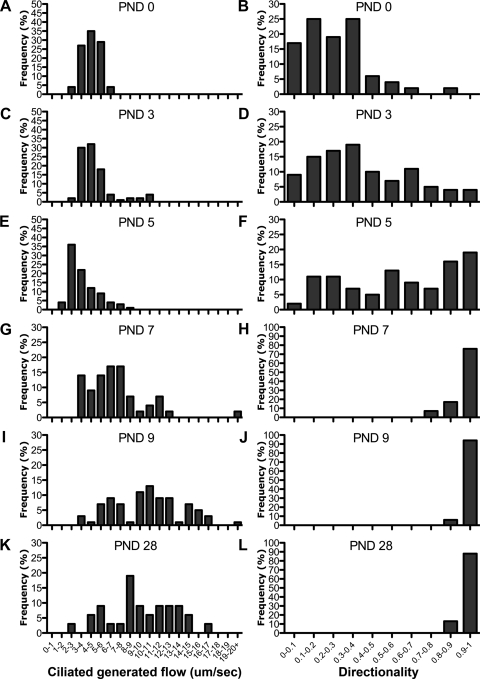
Fig. 3.
Histograms of tracheal flow velocity and flow directionality. Distributions of all microsphere speed and directionality measurements are shown (n = 48, 81, 101, 41, 51, 31, for PND 0, 3, 5, 7, 9, and 28, respectively). Note the broadening distribution of speed, while directionality plateaued to maximal flow directionality at PND 7.

