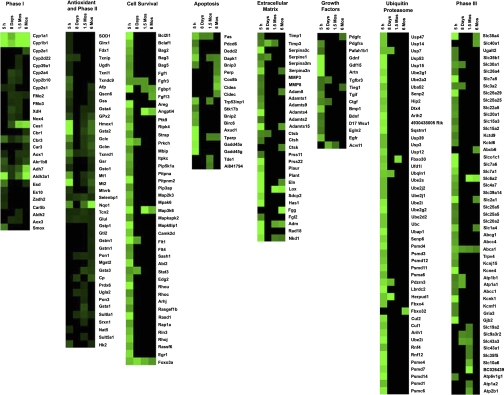
Fig. 6.
Pulmonary gene expression profiles of A/J mice exposed to CS. Cluster analysis shows the expression of phase I genes, antioxidant and phase II detoxification genes, phase III genes, growth factors, genes constituting the ubiquitin-proteasome complex, and genes involved in cell survival, apoptosis, and extracellular matrix maintenance. The genes are visualized by Treeview. Green indicates upregulated genes, and black represents no significant change in expression. Gene symbols are provided.

