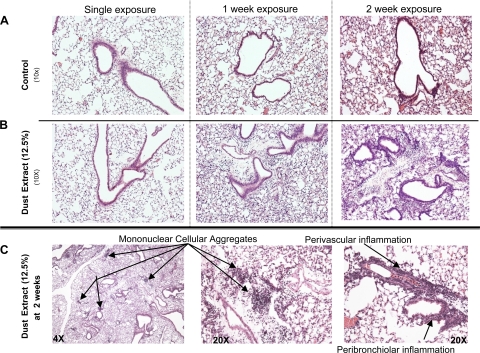
Fig. 5.
Histology of lung inflammation following intranasal inhalation of saline and DE (12.5%). A (saline control-treated mice) and B (DE-treated mice): H&E-stained lung sections after single and repetitive exposures shown at ×10 magnification. C: 2-wk DE-treated murine lung sections with arrows indicating mononuclear cellular aggregates (×4 and ×20 magnification) and bronchiolar and perivascular inflammation (×20). A representative 4- to 5-μm-thick section of 1 of 4 mice/treatment group is shown. All lung specimens were inflated to 15 cmH2O during fixation to avoid atelectasis artifact.

