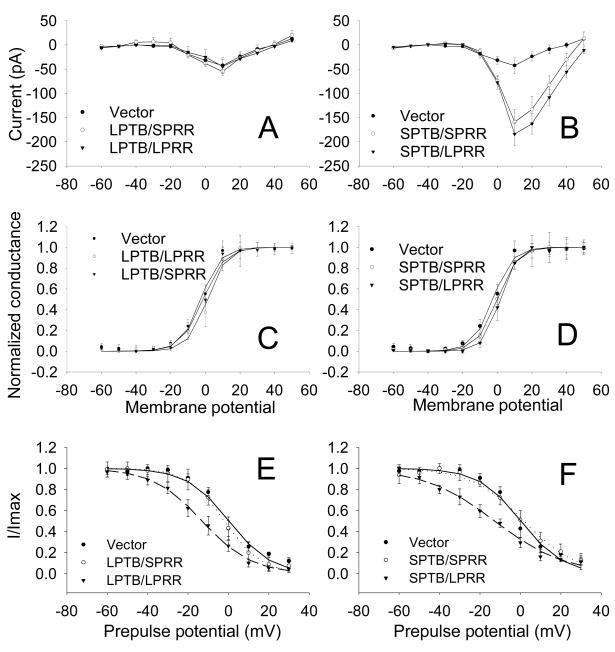
Figure 4.
Ca2+ channel steady state activation (SSA) and steady-state inactivation (SSI). A. Current-voltage curves of Ca2+ currents in cells expressing vector or SPTB/LPRR, SPTB/SPRR, LPTB/LPRR or LPTB/SPRR Numbs, constructed by plotting the normalized current amplitude at various membrane potentials. B. SSA curve of Ca2+ channels in cells expressing vector and various Numb isoforms. The steady-state conductance (G) and voltage (V) data were transformed from the I−V data shown in A. The curves show data that were fit with the Boltzmann equation of the following form: G/Gmax = 1/(1 + exp (V−V1/2)/S), where Gmax is maximum conductance, V1/2 is half-maximal voltage, and S is the slope. C. Plot of I/Imax for cells transfected with vector (filled circle, n=7), SPTB/SPRR (empty circle, n=6) and SPTB/LPRR (filled triangle, n=6). Current amplitude (I) from the inactivation protocol (#), normalized to the maximum (Imax), was plotted as a function of prepulse membrane potentials and best fitted with a Boltzmann function: I/Imax=1/(1+exp (V1/2−V)/S). V1/2: the pooled half-maximal voltages. # to determine the SSI, a standard +10 mV test pulse for 40 ms was elicited from a holding potential of −80 mV, preceded by a 5-second (steady-state) incremental depolarization from −70 mV to +30 mV every 20 seconds. D. Plot of I/Imax for vector (filled circle, n=7), LPTB/SPRR (empty circle, n=6) and LPTB/LPRR (filled triangle, n=5). Values are the mean ± SEM.

