
Figure 4.
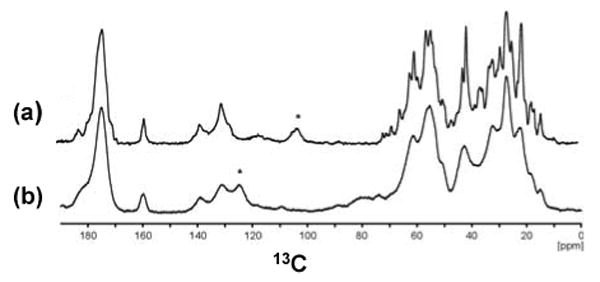
1D 13C CPMAS spectra of U-αB obtained from different sample preparations. (a). αB precipitated from a solution with PEG8000. (b). Lyophilized αB. Both spectra were recorded with ∼85 kHz 1H decoupling and 15 ms acquisition time at 12 °C. During CP, a field of ∼60 kHz and ∼50 kHz was applied on 13C and 1H, respectively. The spectrum in (a) was recorded at a field of 16.4 Tesla and a MAS frequency of ωr=10 kHz. The spectrum in (b) was recorded at a field of 18.8 Tesla and a MAS frequency of ωr=8 kHz. Spinning sidebands are marked with an asterisk.