
Figure 8.
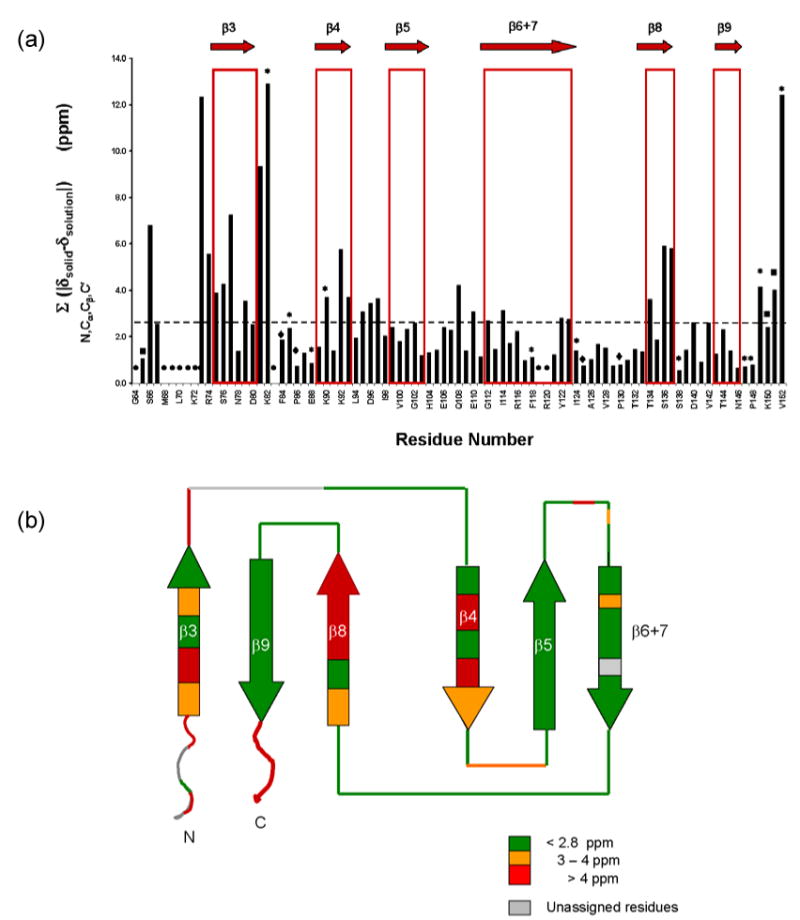
(a). Sum of the absolute values of the chemical shift differences of 15N, 13Cα, 13Cβ, and 13C′ resonances (ΣN,Cα,Cβ,C′|δsolid-δsolution|) plotted versus residue number. The secondary structure is shown at the top of the histogram. Dashed horizontal line represents the mean value. Residues that have either some or all resonance assignments missing are indicated as follows:
• : 15N, 13Cα, 13Cβ, and 13C′; ◆ :15N; ∗ :13C′; ¦ :13C′ and 13Cβ
(b). Chemical shift differences between solid- and solution-state NMR data shown mapped on the topology of αB10.1. Color coding is as follows: < 2.8 ppm: green (no perturbation); 3-4 ppm: orange; > 4 ppm: red. Edge strands, β3, β4, and β8, some loop regions as well as the N and C-termini experience significant chemical shift perturbations. No information is available for regions colored gray due to missing assignments.