
Fig. 5.
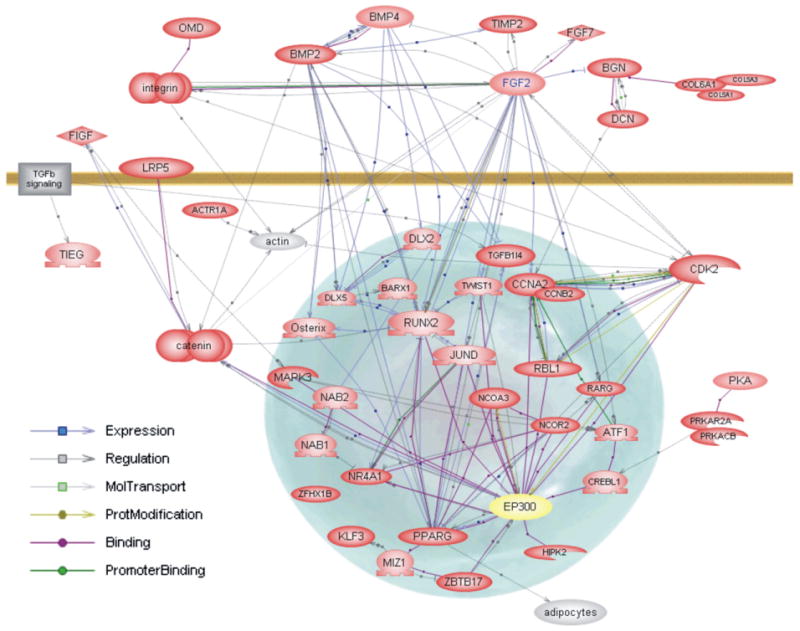
Literature interaction map of osteoblast early commitment network. Selected genes from the functional analysis that were significantly enriched in one or more functional classes were analyzed using PathwayAssist. The genes are actively linked to PubMed using a ResNet database and evidence for relationships can be accessed, with an Internet connection, using the maps on our web site, by clicking on the box that is on the line connecting two genes. A gray line (either solid or dotted) with arrow (+) or bar (−) with a gray box indicates that Gene A in some way interacts, regulates orcoordinately changes, with Gene B. A blue line with arrow or bar with a blue box indicates Gene A regulates expression of Gene B. A purple line with purple circle indicates that product of Gene A binds product of Gene B under some condition or that product of Gene A and Gene B has some similar property, such as binding a given antibody or DNA sequence. A light green line with green circle indicates the product of Gene A (i.e. a kinase) modifies product of Gene B in some way, e.g. phosphorylation. A dark green line with dark green circle indicates product of Gene A binds the promoter of Gene B. The official gene symbol is used to mark each gene that increases in the confluent state and is marked as a red oval. Genes in yellow ovals either do not change in expression or do not exist on the tested microarray chips, but are linked to important components of the pathway that do change in expression.