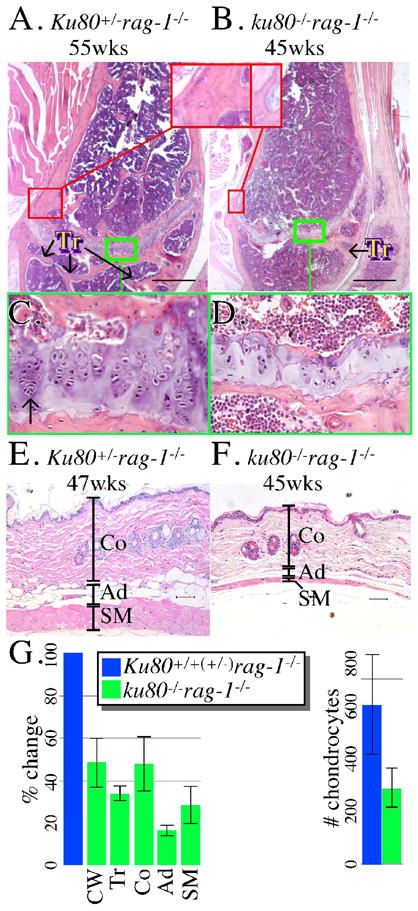
Fig. 2.

Microscopic analysis. (A, B) Femur from a (A) 55 week-old Ku80+/− rag-1−/− and a (B) 45 week-old ku80−/− rag-1−/− mouse. Compare thickness of the bone wall (red boxes) and number of trabeculae (Tr). (C, D) Compare the columnar organization and number of chondrocytes from (C) Ku80+/− rag-1−/− and (D) ku80−/− rag-1−/− mouse. Green box from A, B. Arrow indicates chondrocytes. Scale: 500 mm. (E, F) Skin taken from the dorsal–cervico-thoracic region from a (E) 47 week-old Ku80+/− rag-1−/− and a (F) 45 week-old ku80−/− rag-1−/− mouse. Compare thickness of the three skin layers. (Co, Collagen; Ad, Adipose; SM, Skeletal Muscle) Scale: 50 mm. (G) Quantitation of results for Ku80+/+(+/−) rag-1−/− (blue) and ku80−/− rag-1−/− (green) mice. Three control and 3 ku80−/− rag-1−/− mice observed for trabeculae. Four control and 3 ku80−/− rag-1−/− mice observed for cortical wall thickness, skin layers and chondrocytes. Left: % change compared to the mean of the control. Right: the mean number of chondrocytes in the epiphysis. Refer to Experimental procedures for quantification methods.
