Fig. 3.

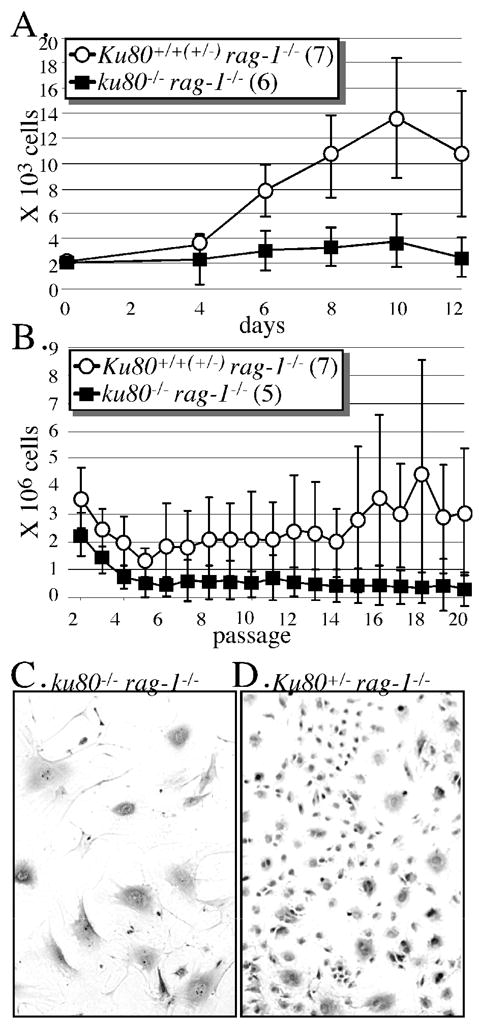
Mouse skin fibroblast analysis. All cells derived from the ears of mice between 32.4–39.5 weeks of age and incubated in atmospheric O2. (A) MSF proliferation curve. Cells (passage 2) derived from seven Rag-1-mutant controls and six double mutant mice. (B) Modified 3T3 analysis to measure lifetime proliferation capacity. MSF (passage 2) are seeded onto two 3.5 cm plates (3.7 × 10⁴ cells/3.5 cm plate). Every 3.5 days cells were trypsinized, combined, counted and seeded at their original concentration onto another 2 plates. As total cell number declined below 7.4 × 10⁴, then cells were seeded onto a single plate at the original concentration. Passaging was discontinued when less than 3.7 × 10⁴ cells remained. (C) Picture of cells (passage 4) derived from the ears of a double mutant mouse. Note the flattened appearance for the double mutant MSF. (D) Picture of cells (passage 4) derived from the ears of a Rag-1-mutant control mouse. Note the spindle-shaped appearance for the Rag-1-mutant control MSF.
