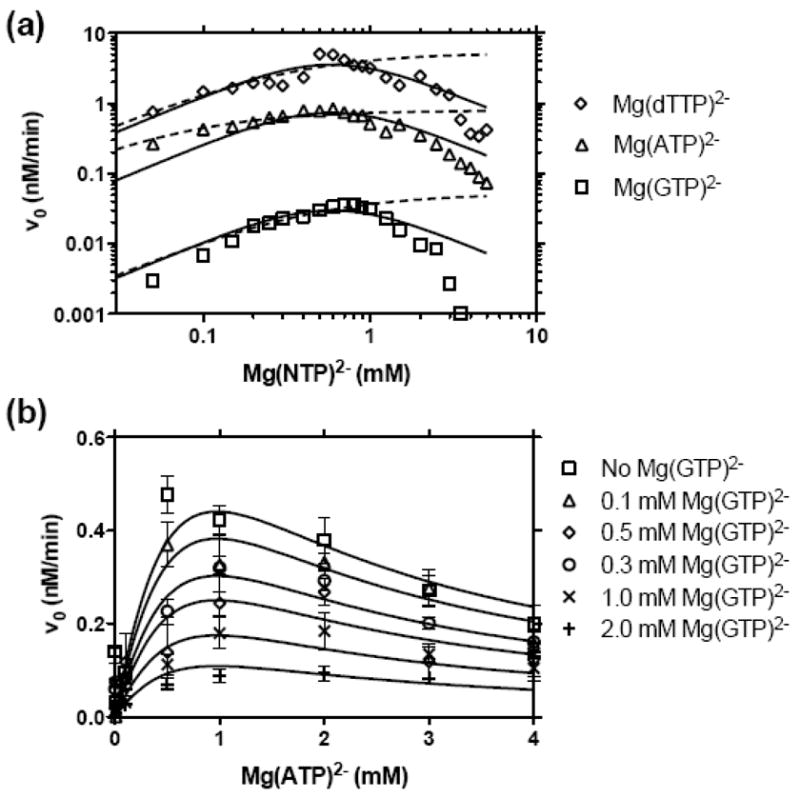
Figure 2.

NS3h_1b(con1) catalyzed DNA unwinding at various NTP concentrations. MBHAs were performed as described in Figure 1 except that various concentrations of NTPs were used and MgCl2 was added to each reaction such that only 0.25 mM free Mg2+ was present at the start of each reaction, assuming Mg2+ forms a 1:1 complex with ATP with a high affinity. For example, reactions with 1 mM ATP, contained 1.25 mM total MgCl2, whereas those with 0.2 mM dTTP contained 0.45 mM MgCl2. (a) Comparison of reactions activated by GTP (squares), ATP (triangles), and dTTP (diamonds). The data are globally fit to a model for substrate inhibition (equation (2), solid lines), with a Ka describing NTP activation of 3.8 mM and a Ki describing NTP inhibition of 0.09 mM. In this model each NTP supports a different Vmax: GTP= 0.41 nM/min, ATP = 10 nM/min, and dTTP = 50 nM/min. In an alternate analysis, data for reaction performed at or below 1 mM NTP were fit to the Michaelis-Menten equation (dotted lines) with the following constants: Km (GTP)= 0.41 mM, Vmax (GTP) = 0.05 nM/min, Km (ATP)= 0.07 mM, Vmax (ATP) = 0.79 nM/min, Km (dTTP)= 0.30 mM, Vmax (dTTP) = 5.3 nM/min. (b) Initial rates of NS3h catalyzed DNA unwinding in the presence of various concentrations of ATP and GTP. Data are fit to a model where GTP acts as a non-competitive inhibitor while ATP acts as an activator and substrate inhibitor (equation (3)) with a Ka (ATP) of 1.3 mM, Ki (ATP) of 0.69 mM, Kii (GTP) of 0.65 mM, and a Vmax of 1.6 nM/min.
