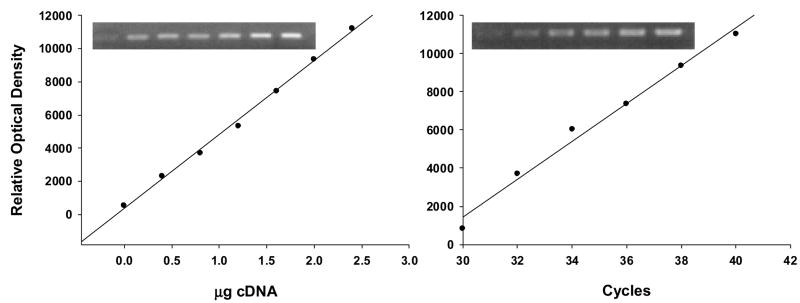
Figure 1.
The figure shows an example of optimized RT-PCR conditions for ERα mRNA using control hippocampus. Note the linear and parallel increases in the optical density of ERα bands with increasing amount of complementary DNA (a) or PCR cycles (b). Optical density is expressed in arbitrary units. Images represent increasing concentration (a) or cycles (b) from left to right. The increase in the ODs of ERα was linear between 0.5 to 1.2 μg cDNA at 36 cycles (Fig. 1a). In addition, there was strong linearity for ERα mRNAs in a range between 32 and 40 cycles (Fig. 1b). A similar linearity was established for ERβ.

