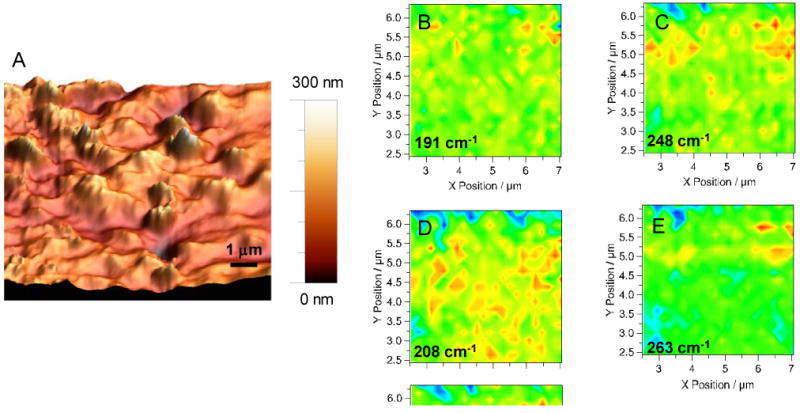
Figure 7.

A 10 μm × 10 μm AFM topography image of bundles of SWCNT up to 300 nm in height dispersed on a Au surface are shown (A). Raman near field images obtained from the central region of the AFM scanning region at 191 (B), 248 (C), 208 (D), and 263 cm-1(E) are shown illustrating spatial variation in nanotube diameter across the sample. The micron position of the near field images is relative to the displayed AFM scan. In the near field images high intensity corresponds to a red color, while low intensity is a blue color.
