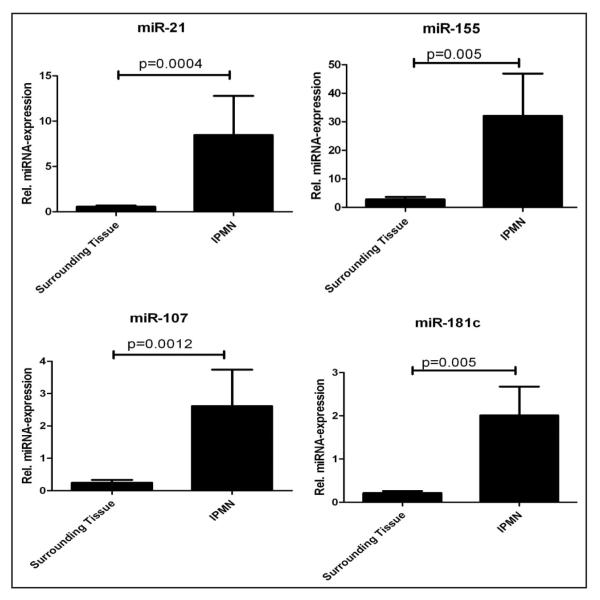
Figure 1.
Relative fold expression of miRNAs in microdissected IPMNs compared to matched non-neoplastic pancreata. Each panel represents a miRNA assessed by qRT-PCR. The two bars represent either surrounding non-neoplastic tissue, or IPMN epithelium. Each sample was assessed in triplicate, and U6 non-coding RNA was used as housekeeping control. The Y-axis represents the average of the relative fold expression levels for each group (IPMNs versus controls). Error bars represent standard errors of the mean. The significance level is designated on the panel. Only four of the 12 miRNAs examined are shown.

