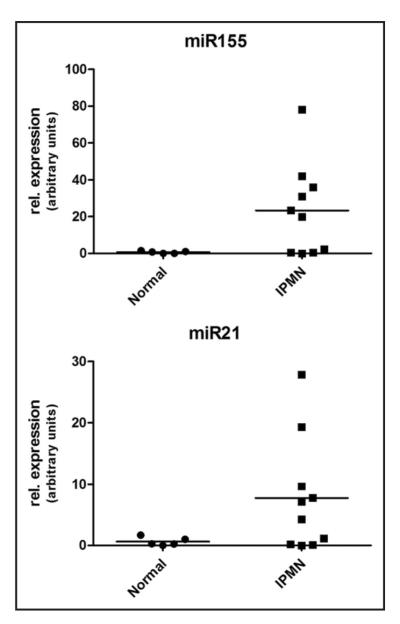
Figure 3.
Expression of miR-155 and miR-21 in pancreatic juice samples assessed by qRT-PCR. Analysis by qRT-PCR of pancreatic juice samples from ten patients with IPMNs and five disease controls. The X-axis designates the two categories of patients for each miRNA and the Y-axis designates the relative fold expression in each pancreatic juice sample. The horizontal bar represents the group average. Note that the Y-axis values differ in miR-155 and miR-21, reflecting a greater fold elevation in the former.

