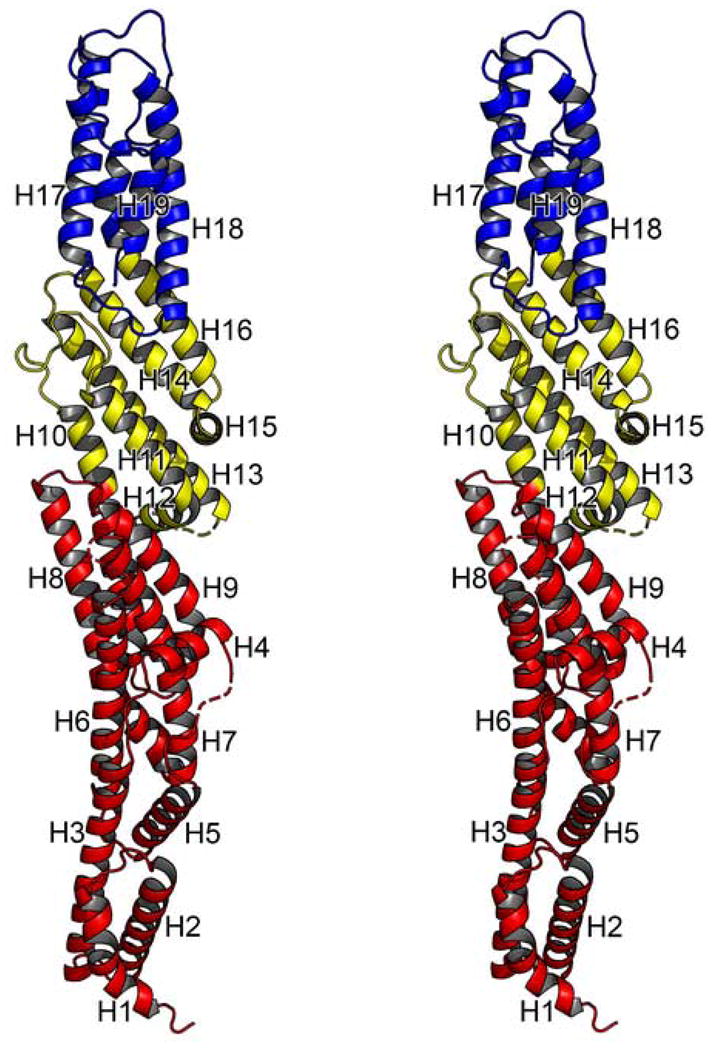
Figure 1. The Structure of Exo70.

Stereo cartoon diagram of MmExo70 is shown. Residues of the N domain are shown in red, M domain in yellow, and C domain in blue. α-helices are drawn as coils and labeled from H1 to H19; turns and loops, solid tubes; unobserved residues, dashed lines (no β strands are observed in the structure).
