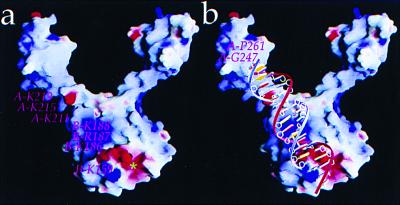
Figure 3.
Electrostatic potential map of the HIV-1 IN52–288 dimer. (a) The dimer orientation is the same as in Fig. 2a. Potentials range from −15/kT (red) to +15/kT (blue). The strip of positive charge (blue) coursing up and to the left contains residues from both monomers of the dimer, K211, K215, and K219 from monomer A and K159, K186, R187, K188 from monomer B. The active site pocket of monomer B (*) includes catalytic residues D64, D116, and E152. (b) An 18-bp viral DNA end is modeled onto the IN dimer with the positively charged residues in contact with the DNA phosphodiester backbone. The adenine base of the conserved viral 3′ CA dinucleotide contacts K159. Docking of DNA was done with midas (46). Figure was generated by grasp (47).

