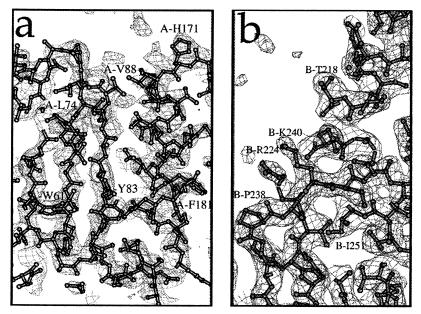
Figure 4.
Electron density plots from the IN52–288 structure. (a) Plot of a simulated annealing composite omit map showing 2Fo−Fc density contoured at 1 σ in a region of the HIV-1 IN52–288 catalytic core domain. The refined structure is superimposed on the density plot. (b) Plot of a 2Fo−Fc map, contoured at 1.2 σ, around linking helix α6 and the C-terminal domain of monomer B. At the left is the cis-proline, P238, where β2 sharply changes direction and transitions between the two β-sheets within the C-terminal domain. Maps were generated by cns (20). Figure was generated by molscript (44) and locally written frodomol.

