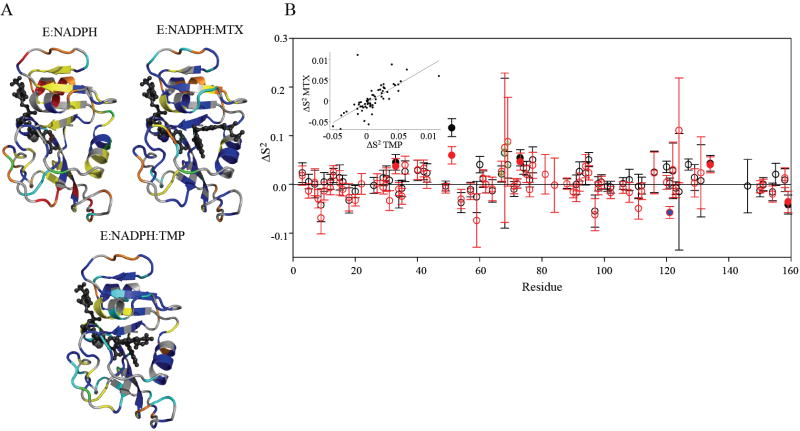
Figure 4.
The “model-free” dynamic response of DHFR to drug binding. A) Model selection results for E:NADPH, E:NADPH:MTX, and E:NADPH:TMP. Structures are colored as follows (models 1-5): S2 only in blue; S2 and τe in cyan; S2 and Rex in yellow; S2, Rex, and τe in green; and S2 f, S2 s, and τe in red. Residues that did not fit to a model are orange, and residues that could not be fit due to spectral overlap are gray. B) The change in backbone order parameter due to MTX (red) and TMP (black) binding to the holoenzyme. Residues that experience consensus significant change are indicated by filled circles. G121 (blue fill) shows a dynamic response in the MTX complex. Residues 67-69 (green stippling) exhibit a consistent, slight increase in rigidity. The inset shows the correlation in the dynamic responses of DHFR (relative to holoenzyme) to binding both drugs.

