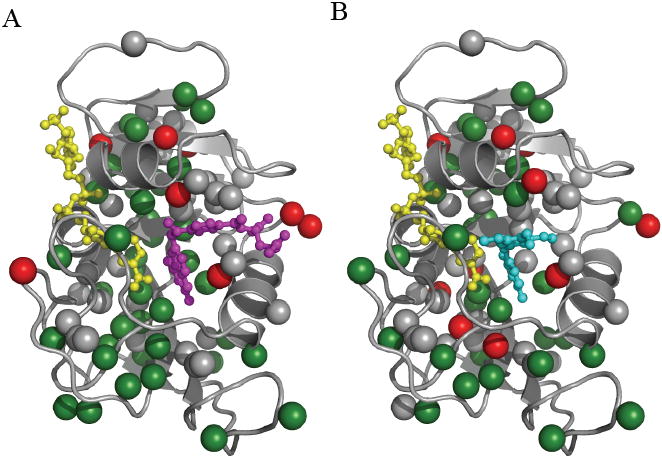
Figure 5.

Distribution of methyl bearing side chains in DHFR. Methyl sites within DHFR are represented by the colored spheres. Residues that show significant change in order parameter (> 2x error) as a result of binding A) MTX or B) TMP to the holoenzyme are shown in red. Residues that do not change are represented by green spheres. Methyl sites that were not comparable due to spectral overlap in the drug bound and/or holo enzyme are colored gray. The ligands MTX, TMP, and NADPH are shown in magenta, cyan, and yellow, respectively.
