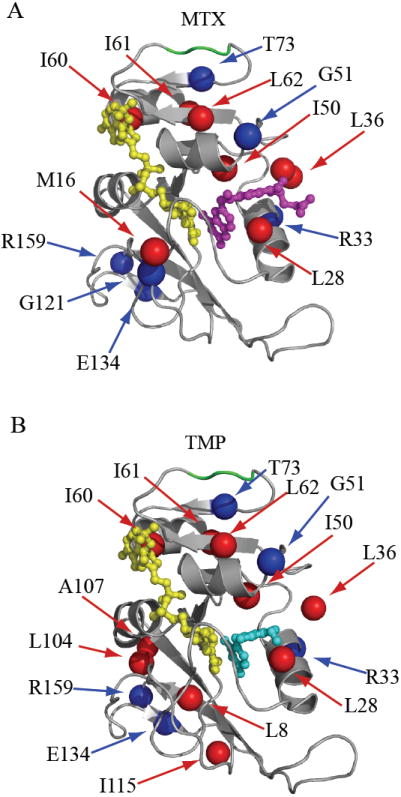
Figure 6.

Summary of ps-ns dynamic changes. The dynamic response as a result of binding MTX or TMP are illustrated in A) and B), respectively. Residues with significant change in backbone amide (blue) and side-chain methyl (red) order parameter (complex – E:NADPH) are mapped onto the DHFR structure. Residues 67-69 are highlighted in green. The ligands MTX, TMP, and NADPH are shown in magenta, cyan, and yellow, respectively.
