
Figure 2.
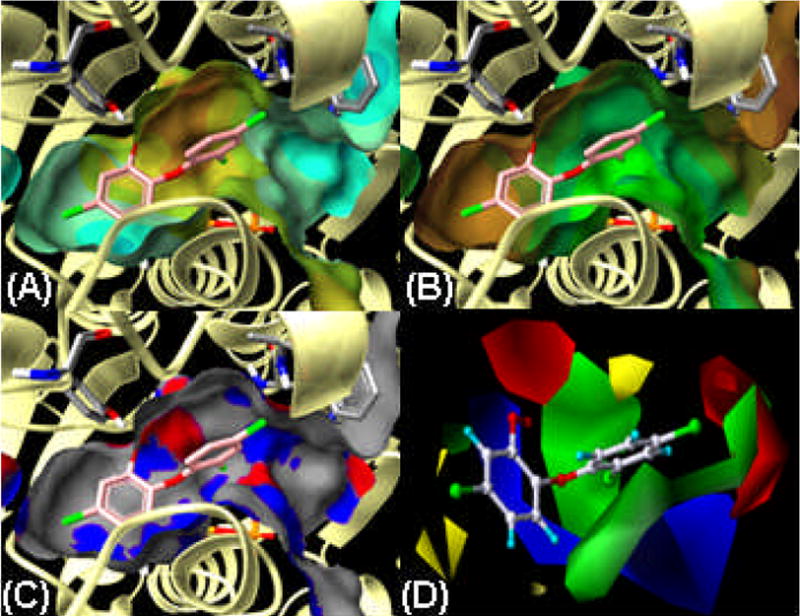
Surface maps of the BaENR active site. (A) Electrostatic Potential surface map, areas shaded orange/yellow indicates regions of moderate positive charge on BaENR, whereas cyan shading indicates areas of neutral charge. (B) Lipophilic map, with a brown to green scale, where brown depicts the more hydrophobic areas. (C) Hydrogen bonding map, where the blue and red areas indicate places for either hydrogen bonding acceptors or donors, respectively. (D) Steric and electrostatic fields from CoMFA based on IC50 values. Steric fields are green and yellow, indicating regions of favorable and unfavorable steric expansion. Electrostatic fields are red and blue, indicating preferred regions of negative and positive charge. Surface maps were generated using the Benchware software and CoMFA fields are generated within Sybyl 7.2, both softwares from Tripos, Inc., St. Louis, MO.