Figure 3.
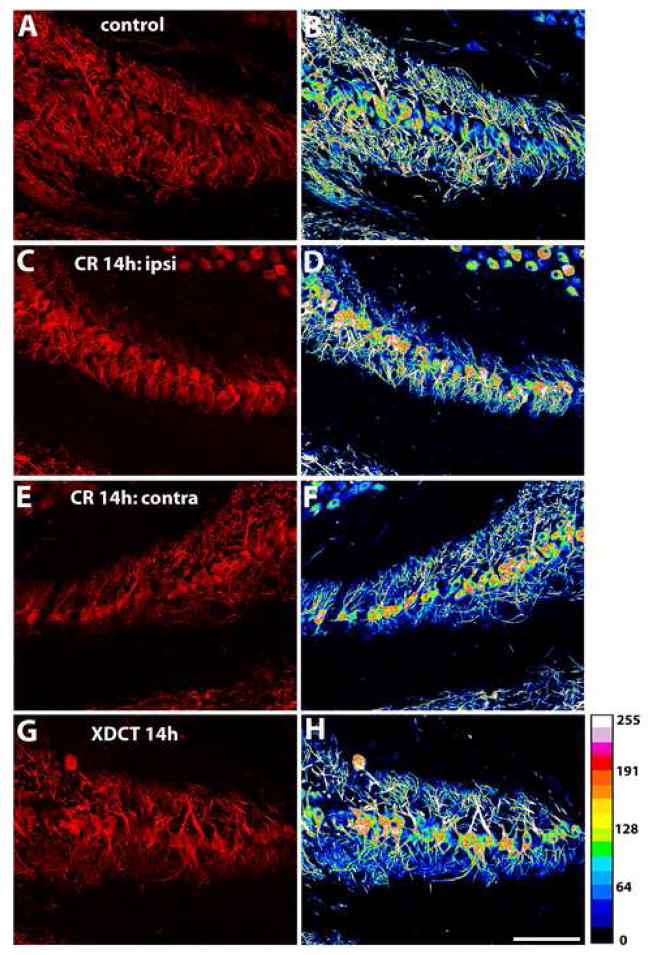
MAP2 immunoreactivity in the caudal portion of NL before and 14 hours after cochlea removal or XDCT transection. A–B: In the normal NL, the staining density of MAP2 immunoreactivity is similar between the dorsal and ventral dendrites. C–F: MAP2 immunoreactivity in the ipsilateral (C-D) and the contralateral (E-F) NL at 14 hours following cochlea removal. Deafferented dorsal dendrites of the ipsilateral NL and ventral dendrites of the contralateral NL exhibited a distinct decrease in MAP2 immunoreactivity, as compared to the intact dendrites. G–H: MAP2 immunoreactivity in NL at 14 hours following XDCT transection. Deafferented ventral dendrites on both sides of the brain exhibited a distinct decrease in MAP2 immunoreactivity, as compared to the intact dorsal dendrites. A, C, E, and G are the confocal photomicrographs. B, D, F, and H are the spectrums resulting from the corresponding photomicrographs using Image J software (version 1.38X; National Institutes of Health). These spectrum images use 16 colors to present different levels of the intensity in a photomicrograph. They demonstrate that deafferented dendritic domains contain less dendritic branches with high intensity of MAP2 immunoreactivity than the intact dendritic domain. Spectrum scale is presented on the lower right corner of the figure. Scale bar = 100 μm.

