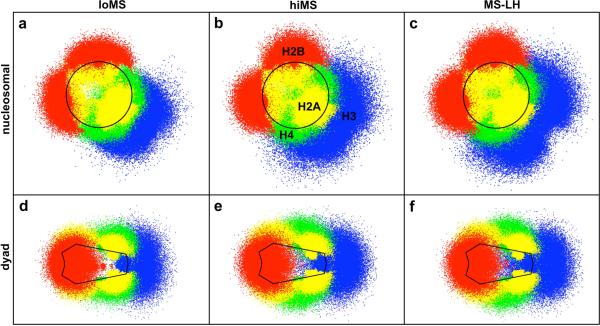
Figure 5.
Positional distribution of histone tails under different conditions: low monovalent salt (a,d); high monovalent salt (b,e); and high monovalent salt with bound linker histones (c,f). The upper panel (a-c) represents the histone tail positions projected onto the nucleosomal plane of the parent nucleosomes, and the lower panel (e-f) represents the positions projected onto the dyad plane of the parent nucleosomes. The tails are colored as: H2A, yellow; H2B, red; H3, blue; and H4, green. The nucleosome boundaries are indicated by the solid black lines.

