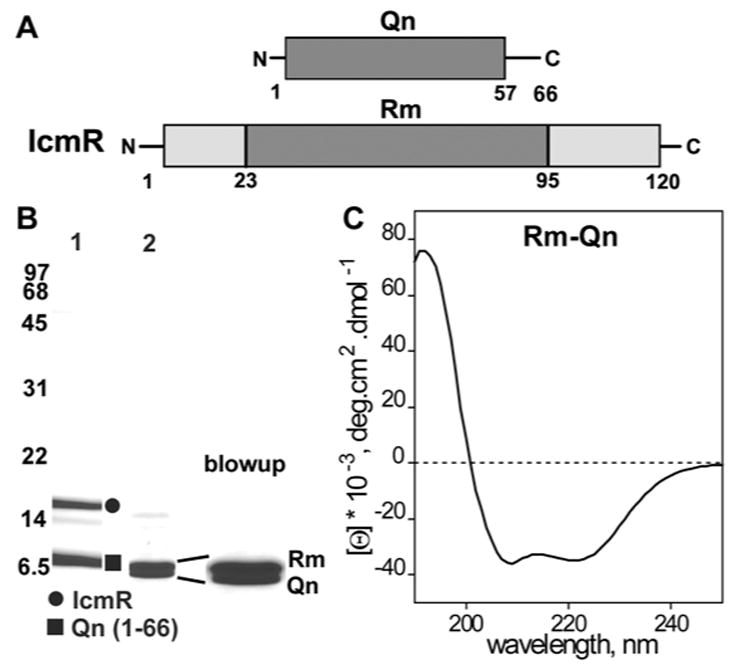
Figure 3.

Purification and characterization of the Rm-Qn complex.
A. Domain diagrams are shown for IcmR and Qn and the interacting regions are shaded.
B. Purified IcmR-Qn(1-66)-6xHis complex is shown on an SDS gel (lane 1). Trypsinization generates the Rm-Qn complex (lane 2) and the similarly sized bands are shown in an expanded view on the right.
C. A CD spectrum indicates that the Rm-Qn complex is strongly α-helical.
