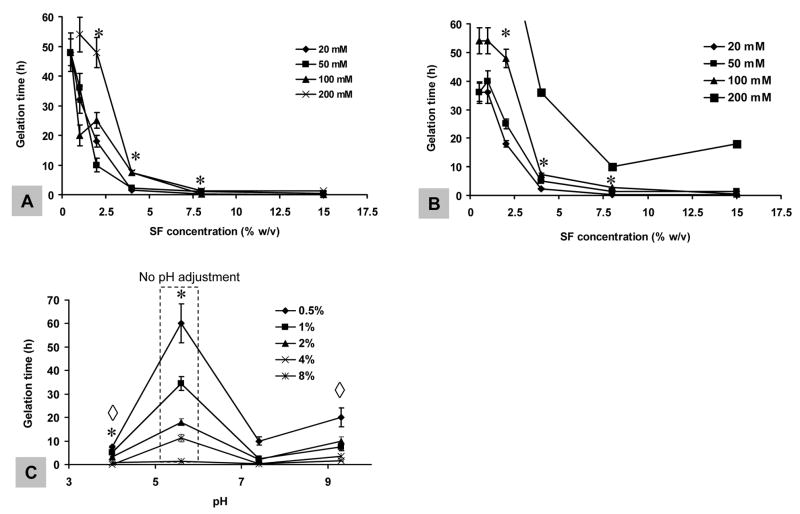
Figure 3.
Salt and pH effects on silk fibroin gelation. Prior to sonication, solutions at various concentrations were supplemented with (A) K+ and (B) Ca2+ to final concentrations of 20 mM – 200 mM and (C) adjusted pHs. Sonication was performed at 20% amplitude for 15 seconds for all samples. Values are average ± standard derivation of a minimum of N=3 samples for each group. *, ◇ significant differences between the groups (student’s t-test, P<0.05).

