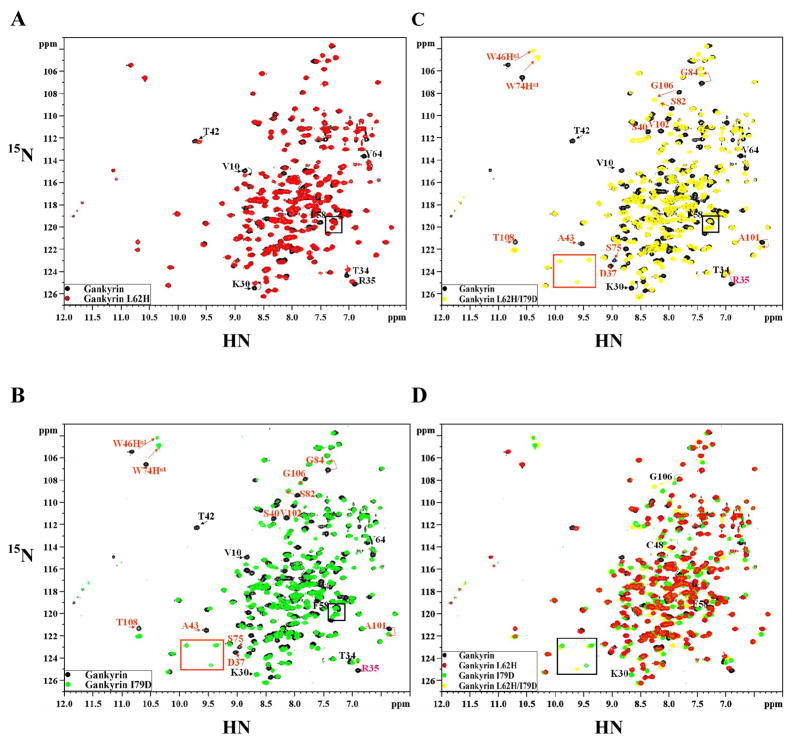
Figure 5. Comparison of 15N-1H HSQC spectra of wild type gankyrin and its mutants .
The HSQC spectra were obtained in D2O solution using a 600 MHz spectrometer. (A) L62H (red) and wild type (black); (B) I79D (blue) and wild type (black); (C) L62H/I79D (green) and wild type (black); (D) superimposition of spectra in A, B, and C. L62 and I79 peaks in the spectra of wild type gankyrin are in overlapping regions, hence, cannot be precisely pointed at in the respective mutant data. The peaks that show larger chemical shifts are labeled with arrows.

