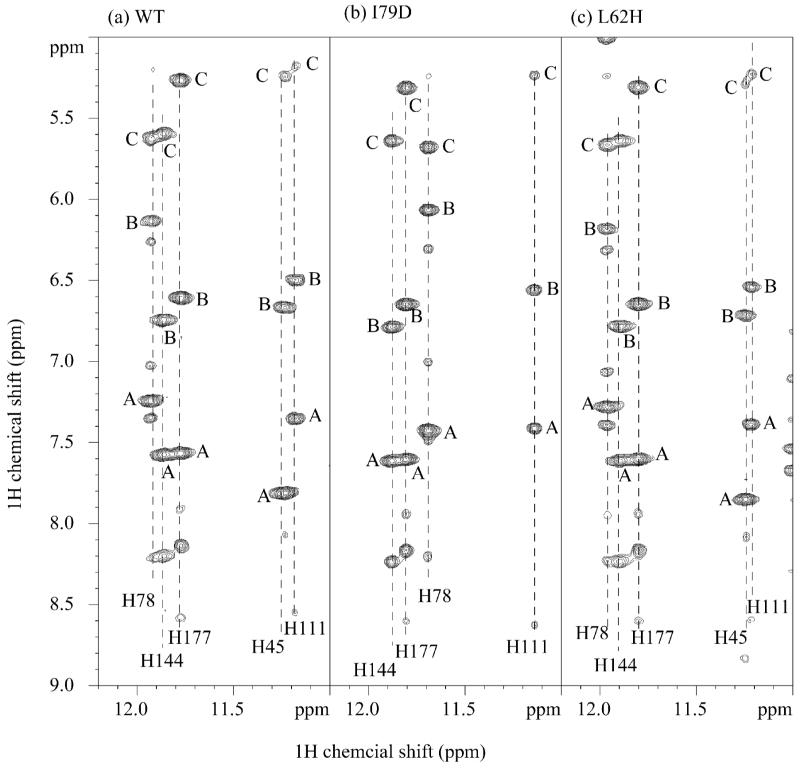
Figure 7. 2D NOESY spectra on WT (a), I79D (b), and L62H (c) showing the proton downfield region.
The cross peaks designated A–C are NOEs from Hε2/His in a TPLH motif to Hε1 and Hδ2 of the same histidine residue, and Hα/(His+30) residue (Hα/T207 for H177), respectively. The latter is a supporting evidence of inter-ankyrin repeat hydrogen bond between Nε2/His and O/(His+29) (e.g. Nε2/H177 and O/K206). It is clear from the comparisons that L62H mutant retains the TPLH features from AR2 to AR6, while I79D has large perturbation in TPLH of AR3 (H78) and ANK4 (H111), and likely disruption in 42TALH45 evidenced by the disappearance of Hε2/H45 signal.

