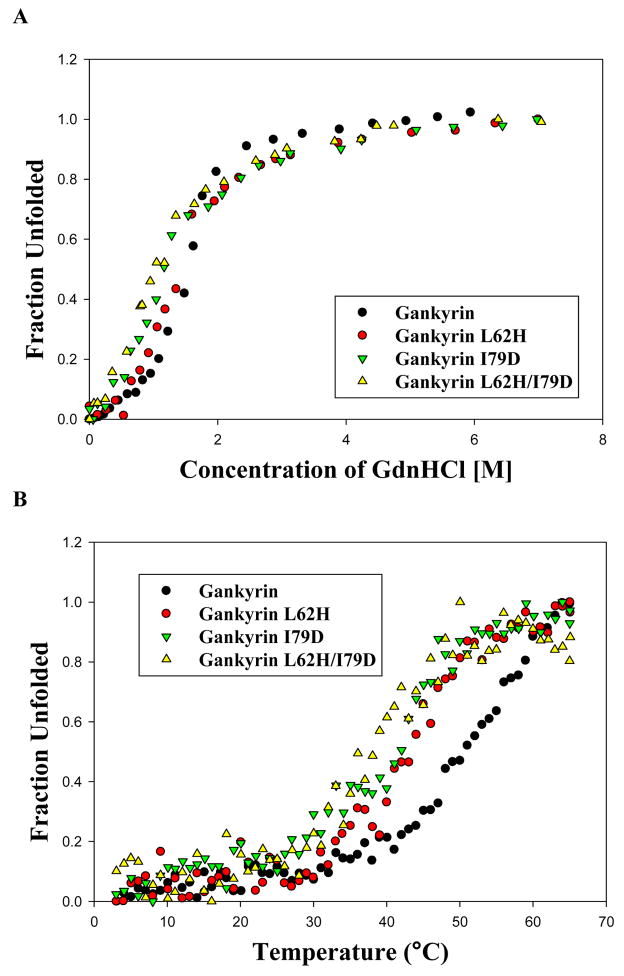
Figure 8. Chemical- and heat-induced unfolding of gankyrin mutants monitored by far-UV CD.
(A) GdnHCl-induced unfolding. Samples containing 7.5–10.0 μM proteins were incubated with different amounts of GdnHCl on ice overnight and the ellipticity at 222 nm was monitored by far-UV CD (190–260nm) at 25 °C. The fraction unfolded, defined as (the ellipticity at 222 nm at a denaturant concentration-the ellipticity at 222 nm at the native state)/(the ellipticity at 222 nm at the fully unfolded state-the ellipticity at 222 nm at the native state), was plotted against the GdnHCl concentration37. The unfolding curve was fitted to a model of two-state approximation25. (B) Thermal melting spectra were recorded at 222nm by heating from 3 °C to 65 °C with a rate of 1 °C per minute and a 1 °C interval. Tm, the temperature at the midpoint of transition, was obtained through fitting the melting curve to a two-state transition model.

