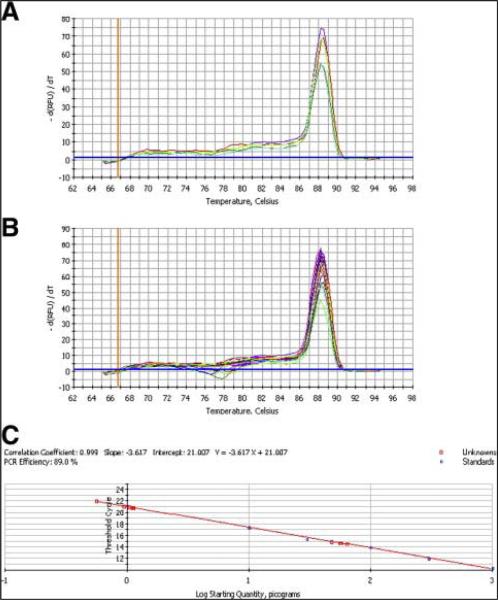
Fig 2.
Copy number determination of the MLCK2 transgene. (A) The melt curve of the plasmid pJM4 at different concentrations demonstrates the formation of a single product with a Tm of 89°C. (B) Depicted are the melt curves of the genomic DNA (blue and red curves) from transgenic mice imposed on top of the plasmid melt curve, which demonstrates fidelity of the transgene PCR product to the PCR product from the original plasmid and ability of the PCR system to determine copy number of the transgene when tested at different dilutions of genomic DNA. (C) Determination of the unknown concentration (copy number) of the transgene (squares) from a standard curve of picogram plasmid (circles) versus ΔCt. (Color version of figure is available online.)

