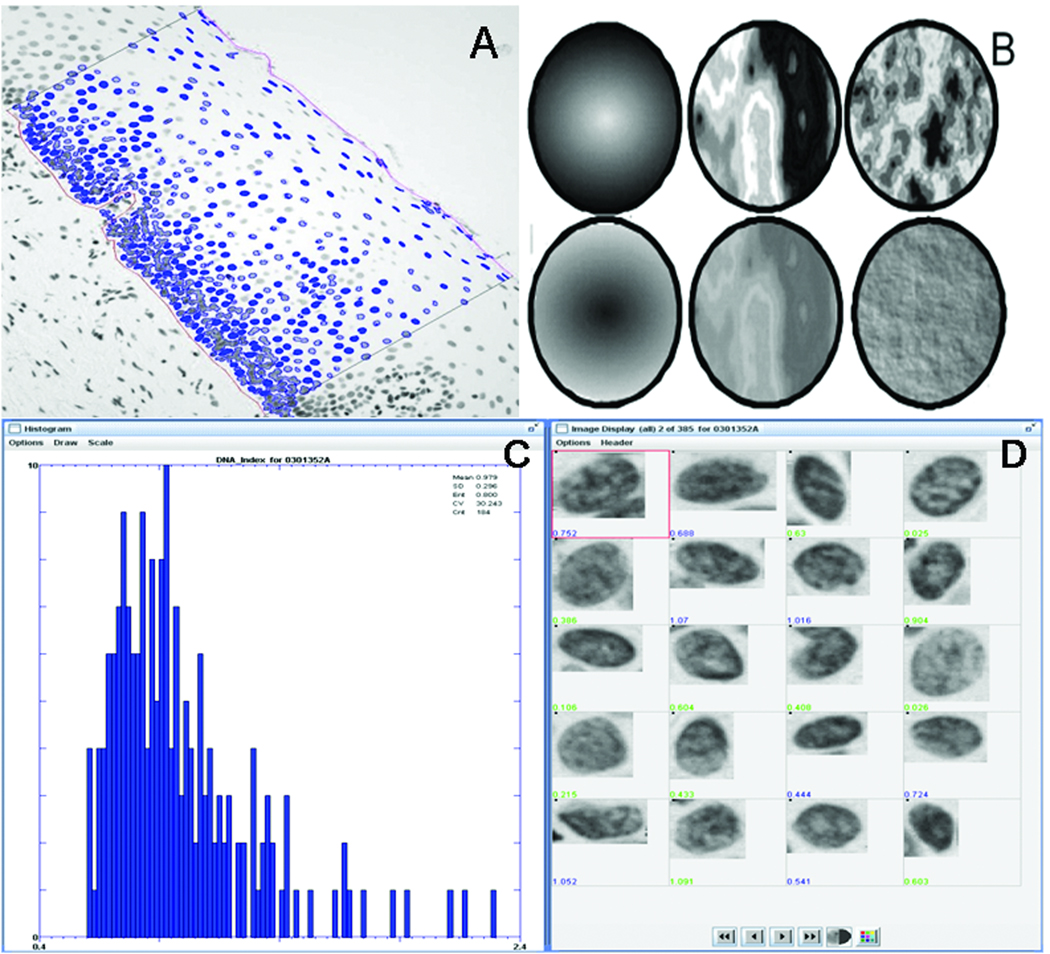
Fig. 1.
Quantitative Tissue Phenotype (QTP) of an oral dysplastic epithelium. A: A Region of Interest (ROI) is manually delineated according to pathologist diagnosis. Nuclei selected by the technician within the ROI are automatically segmented (in blue); B: Graphic representations of 3 of the 110 nuclear features assessed in this study, all of which measure DNA distribution in the nucleus. Top row: OD-Skewness_measures whether the nucleus is dark with light areas or light with dark areas; middle row: Fractal_area1 measures heterochromatin vs. euchromatin organization, i.e. large intensity contrast between highly condensed chromatin and non-condensed chromatin, bottom row: Long90_Run measures the fraction of nuclear diameter one can travel before an intensity change is encountered. C: Nuclei images and corresponding features are displayed for graphical and statistical representation and analysis.

