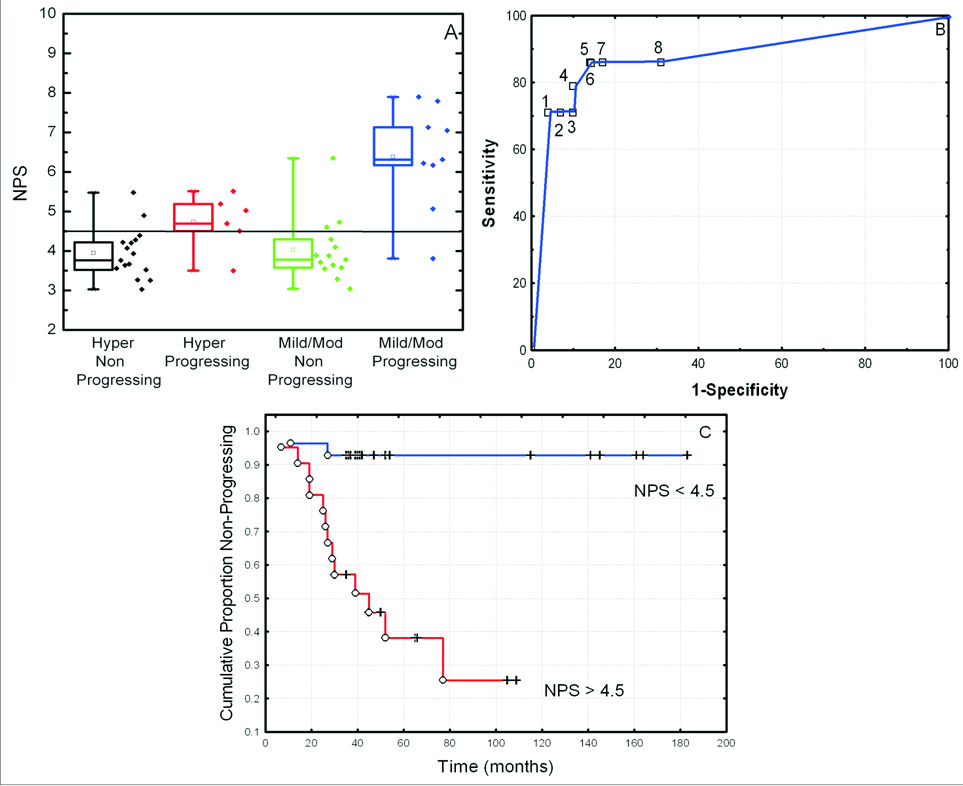
Fig. 4.
Correlation of NPS with progression to cancer for hyperplasia, mild and moderate dysplasia (HMD). (A) Box plots of NPS for progressing and non–progressing hyperplasia, and progressing and non-progressing mild/moderate dysplasia. Error bar represents 5th and 95th percentiles, box represents central 50th percentile and black square represents median NPS values. (B) Receiver Operating Characteristic Curve of NPS to identify progressing lesions with a cut-off value of 4.2 (1), 4.5 (2) and 4.7 (3). (C) Probability of having no progression to cancer, for specimens with a low NPS (NPS <4.5) and specimens with a High NPS (NPS > 4.5).

