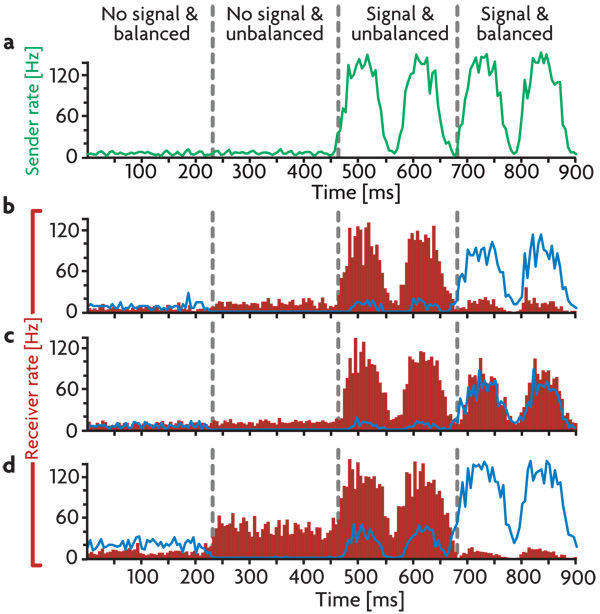
Figure 5. Network Pathologies.
(a) Average firing rate of the sender neurons without and with an oscillatory input. (b–d). Responses of excitatory (red histogram) and inhibitory (blue trace) receiver neurons with: b) Correct tuning. c) Weakened local inhibition, leading to a gating deficit. d) A hyperactive receiver region causing a response to the gating modulation. Conditions shown in the different columns are: No signal and no modulation. No signal but gated on. Signal on and gated on. Signal on but gated off. Firing rates are calculated in 5 ms bins.

