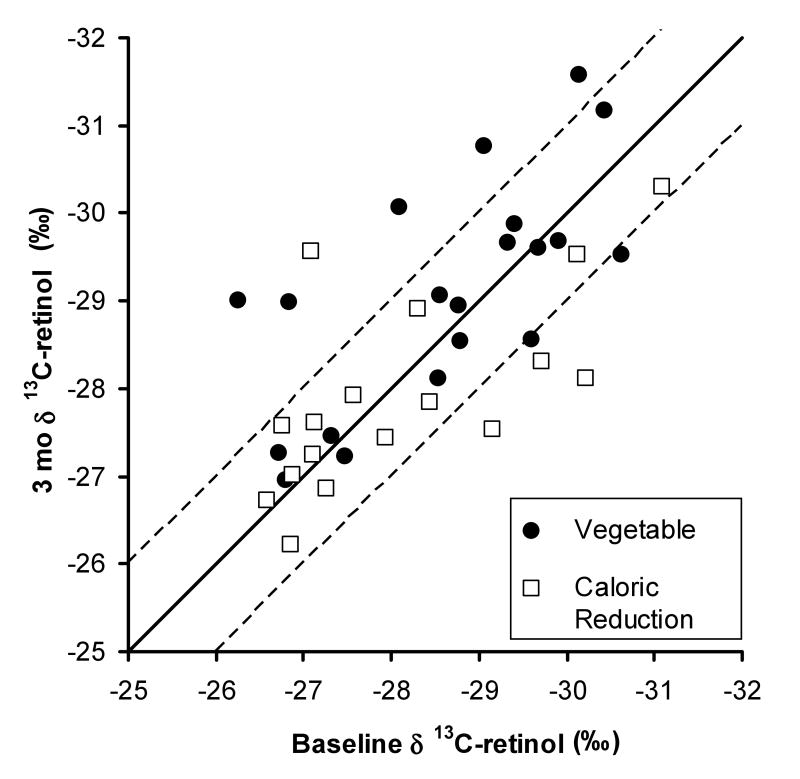
Figure 1.
Baseline versus 3 mo mean δ 13C-retinol values for subjects in the vegetable and reduced calorie and fat g (caloric reduction) groups (n = 20 and 17, respectively). The solid line represents equivalent 0 and 3 mo values, the dashed lines represents ± 1‰ variation in 3 mo δ 13C values compared to baseline. Average standard deviation for δ 13C-retinol values was ± 0.197. Delta 13C-retinol values in the vegetable group decreased from 0 to 3 mo (P = 0.050), but did not change in the caloric reduction group (P = 0.43). The 3 mo change in δ 13C-retinol values between the vegetable and caloric reduction groups was marginally significant (P = 0.054).

