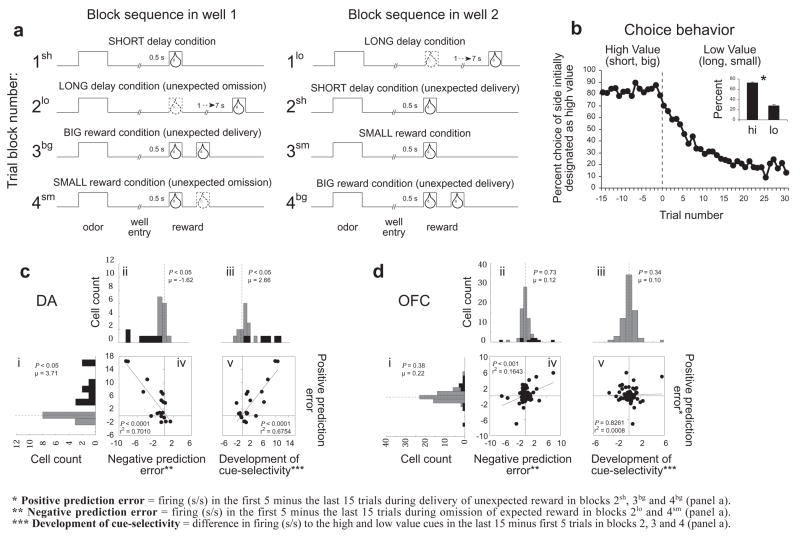
Figure 2. Neural activity in response to errors in reward prediction in OFC versus VTA dopamine neurons.
A. Line deflections indicate the time course of stimuli (odors and rewards) presented to the animal on each trial. Dashed lines show when reward is omitted and solid lines show when reward is delivered. At the start of each recording session one well was randomly designated as short (a 0.5 s delay before reward) and the other long (a 1–7 s delay before reward) (block 1). In the second block of trials these contingencies were switched (block 2). In blocks 3–4, we held the delay constant while manipulating the number of the rewards delivered. Expected rewards were thus omitted on long delay trials at the start of block 2 (2lo) and small reward conditions at the start of blocks 3 and 4 (3sm and 4 sm), and rewards were delivered unexpectedly on short delay trials and big reward trials at the start of blocks 2 (2sh) and block 3–4 (3bg and 4 bg), respectively. B. Line graphs show choice behavior before and after the switch from high valued outcome (averaged across short and big) to a low valued outcome (averaged across long and small); inset bar graphs show average percent choice for high vs low value outcomes. After 5 trials rats had switched their preference to the more valued side, choosing the preferred reward (i.e. short, big) greater than 50% of the time. By the last 15 trials in a block of trials rats were choosing the more valued well greater than 75% of the time. Notably, the change in choice behavior within a given block (first 5 minus last 15 trials) was not significantly different (2-factor anova) across recording group (OFC vs dopamine; P = 0.1435) or value manipulation (delay vs size; P = 0.2311). C and D. Changes in spiking activity during reward delivery and cue sampling in response to errors in reward prediction in reward-responsive VTA dopamine neurons (n = 20) versus reward-responsive OFC neurons (n = 69). Histograms plot the difference in the average firing rate of each neuron in the first five versus the last fifteen trials during the 500 ms after delivery of an unexpected reward (i) or omission of an expected reward (ii) or during the cue sampling period as value selectivity developed (iii). Black bars represent neurons in which the difference in firing was statistically significant (t-test; p < 0.05). P-values in the distribution histogram indicated the results of a wilcoxon text. Boxed scatter plots illustrate neuron-by-neuron correlations between signaling of positive prediction errors and negative prediction errors (iv) or between signaling of positive prediction errors and the development of cue selective responses (v).

