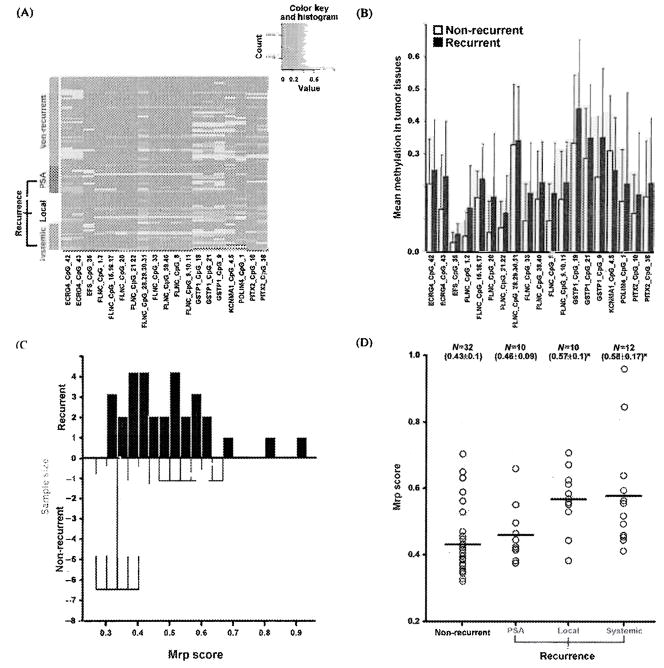
Figure 2.
(A) Cluster diagram depicting CpG units methylation of genes in nonrecurrence and recurrence tumor tissues. Each row represents a tissue and each column a CpG unit of the genes. Green represents nonrecurrent (n = 32) tumors. Blue, yellow, and red represents recurrent tumors (n = 32 total) with PSA failure (n = 10), local recurrence (n = 10), and systemic progression (n = 12), respectively. Frequency of methylation levels is color scaled from red to yellow. Red denotes no methylation, while bright yellow denotes complete methylation. Gray represents technically inadequate or missing data. (B) Group mean methylation of the CpG units of genes in nonrecurrence and recurrence tumors (p value < 0.05). (C) Distribution of methylation similarity scores for recurrence of prostate cancer (Mrp) in nonrecurrence (black bars) and recurrence (white bars) tumor tissues. (D) Mrp score in nonrecurrent and recurrent tumors with PSA failure, local, and systemic progression. n = number of tissues in each group. Mean and standard deviation are shown in parentheses. *p < .05.

