
Figure 2. Data validation by qPCR.
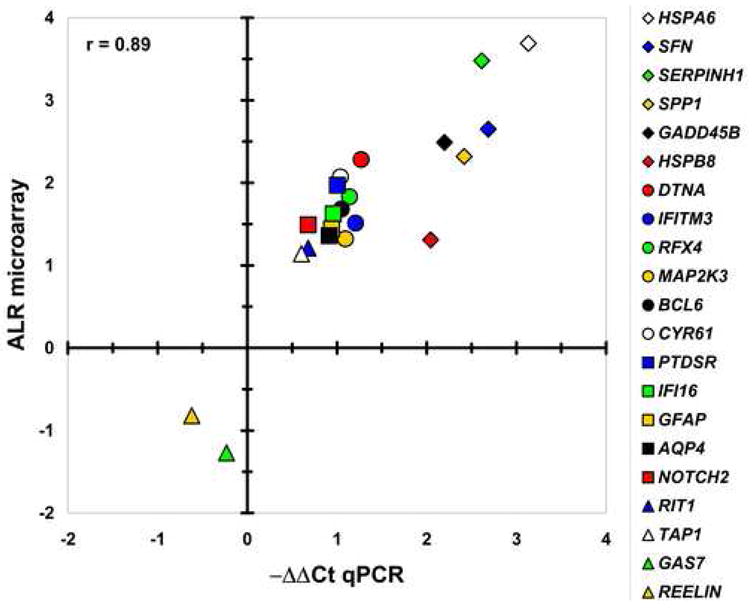
Differential expression of 22 genes was validated by qPCR. X-axis represents -ΔΔCt measured by qPCR, Y-axis denotes DNA microarray reported ALR. Each symbol represents a single gene. Note that the qPCR and microarray data were highly correlated (r=0.89; p<0.001), with agreement in the directionality of change for all investigated transcripts.